Analyze My Running Data on AWS - Part 1
Analyzing my running data in AWS
For the last 6 or so years, I've been collecting data on my runs by my Garmin Forerunner 210 (old school). I download my data and occasionally put it on Strava (athlete data here: https://www.strava.com/athletes/27154641). Since Strava and Garmin use the data and convert it to insights, I wanted to see if I could do the same as well and maybe discover some more insights with my own data.
To get started, I used AWS services to load, and process my data. This means I don't actually have to rely on my computer to execute any code or whatever, and I can potentially put it onto a website, and I guess look at it or something.
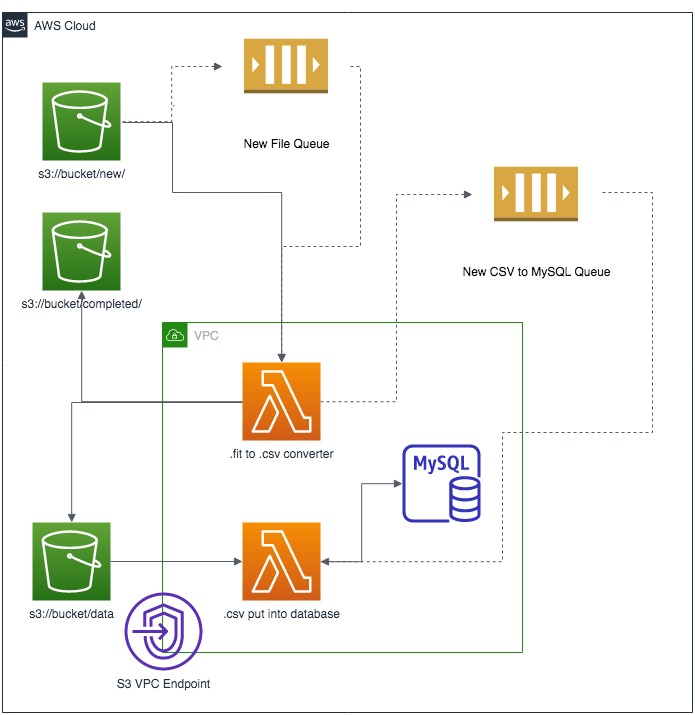
The basic design is depicted in the diagram below, but consists of an S3 bucket to hold the files (low cost), Lambda functions (also really low cost) to process them, and initially I'll use a MySQL RDS for the analytics data store to store the data and generate some aggregate and summary tables (t2.micro instance is in the Free tier). To control the Lambda functions, I've got 2x SQS queues that trigger when a new file is uploaded and when that file is ready to go into my analytics data store.

A couple of points on why this architecture probably isn't ideal:
2 buckets for storage: the raw files and completed files. If it got really big, I could get better about metadata and archiving files to Glacier to lower costs. Right now the cost is like pennies.
MySQL RDS (if outside free tier) - Maybe I could use DynamoDB or Athena/Glue to query the data.
I still need something to do the analysis - I use a Jupyter notebook right now running on an EC2 instance in the free-tier, I could use Sagemaker.
I don't really have an application to look at the insights.
Not really highly available with one MySQL RDS.
After I get this up and running (stick to what I'm comfortable with) I'll probably try some other services or what not to see what works or doesn't.
More posts soon on processing and analyzing the data.